
Modern digital services depend on complex infrastructures made up of cloud platforms, microservices, containers, databases, and third-party integrations. As systems grow more distributed, ensuring reliability and performance becomes increasingly challenging. This is where observability software plays a critical role, enabling organizations to monitor, analyze, and troubleshoot their systems in real time.
TL;DR: Observability software allows organizations to monitor systems in real time by collecting and analyzing metrics, logs, and traces. It provides deep visibility into distributed environments, helping teams detect issues quickly and resolve them before users are affected. Modern observability tools support cloud-native architectures, automation, and proactive alerting. With the right platform, businesses can improve uptime, performance, and overall user experience.
What Is Observability?
Observability refers to the ability to understand a system’s internal state based on the data it produces. In practice, this means collecting and analyzing three primary data types:
- Metrics: Numerical measurements such as CPU usage, memory consumption, response times, and request rates.
- Logs: Detailed records of events, errors, or transactions occurring within applications and infrastructure.
- Traces: End-to-end tracking of requests as they move across distributed services.
Together, these components provide comprehensive insight into application behavior. Observability goes beyond traditional monitoring by enabling teams not just to detect that something is wrong, but to understand why it is happening.
Why Real-Time Monitoring Matters
Real-time monitoring ensures that issues are detected the moment they occur. In industries such as e-commerce, healthcare, fintech, and SaaS, even a few minutes of downtime can result in significant revenue loss and reputational damage.
With real-time observability software, technical teams can:
- Detect anomalies instantly
- Set automated alerts for unusual patterns
- Troubleshoot performance bottlenecks quickly
- Maintain service-level objectives (SLOs)
- Improve customer satisfaction
Instead of reacting to incidents after users complain, organizations can proactively resolve problems before they escalate.
Core Features of Observability Software
Modern observability platforms provide a unified interface for gathering and analyzing data from across the technology stack.
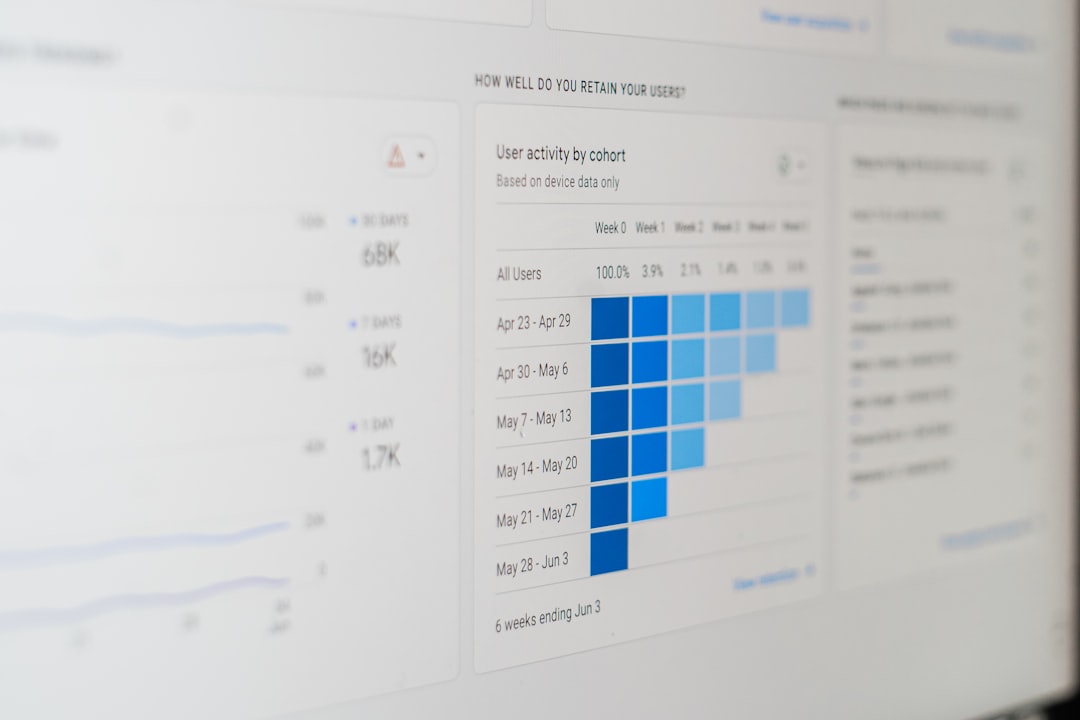
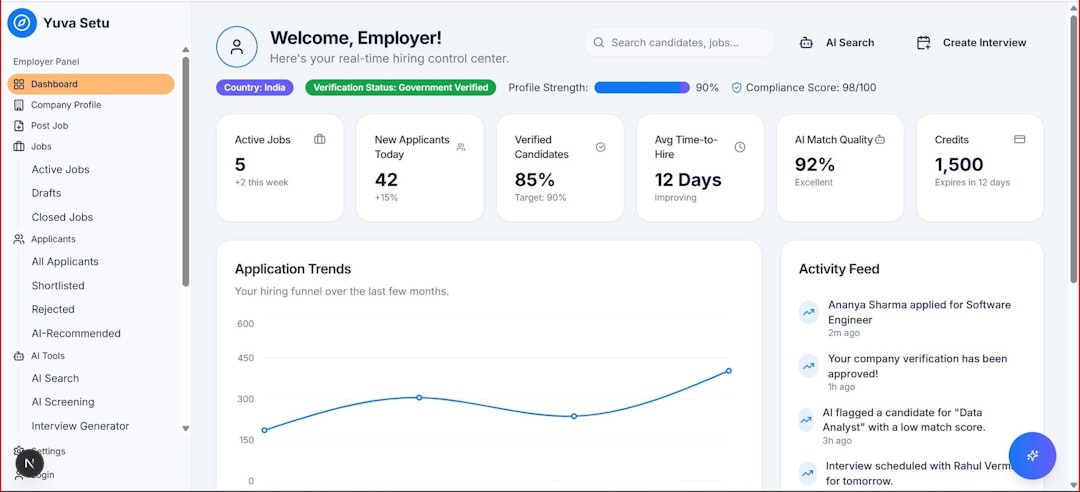
1. Unified Dashboards
Dashboards consolidate metrics, logs, and traces into a single view. This eliminates the need to jump between multiple tools and enables faster analysis. Interactive graphs and visualizations help teams quickly interpret system behavior.
2. Distributed Tracing
In microservices environments, a single user action can trigger dozens of backend processes. Distributed tracing allows engineers to follow a request’s journey across services, identifying latency bottlenecks or failures.
3. Intelligent Alerts
Advanced alerting systems leverage machine learning to reduce false positives. Rather than sending alerts for every minor fluctuation, the software identifies meaningful changes in system behavior and notifies the right teams.
4. Root Cause Analysis
Observability tools correlate metrics, logs, and traces to pinpoint the root cause of issues. This reduces mean time to resolution (MTTR) and minimizes operational disruptions.
5. Scalability and Cloud Integration
Cloud-native observability platforms integrate seamlessly with environments such as AWS, Azure, and Google Cloud. They automatically scale with workloads, ensuring continuous monitoring under varying traffic levels.
Benefits of Using Observability Software
Organizations that implement observability solutions benefit across multiple operational layers.
Improved System Reliability
Continuous monitoring ensures systems perform optimally. Real-time data helps teams identify performance degradation early and proactively manage risks.
Enhanced Developer Productivity
When issues arise, engineers can quickly locate root causes without manually reviewing vast volumes of logs. This efficiency allows teams to focus more on innovation and less on firefighting.
Better User Experience
Fast, reliable applications lead to higher customer trust and retention. Observability ensures consistent performance even during peak demand periods.
Data-Driven Decision Making
Business leaders can use observability insights to forecast infrastructure needs, optimize resource allocation, and plan future scaling strategies.
Top Observability Tools for Real-Time Monitoring
Several leading platforms help organizations achieve comprehensive system visibility. Below are some widely adopted observability tools:
- Datadog
- New Relic
- Dynatrace
- Grafana (with Prometheus)
- Splunk Observability Cloud
Comparison Chart of Popular Observability Tools
| Tool | Best For | Key Strength | Deployment |
|---|---|---|---|
| Datadog | Cloud-first businesses | Comprehensive integrations | SaaS-based |
| New Relic | Application performance monitoring | Deep application insights | SaaS-based |
| Dynatrace | Enterprise environments | AI-driven root cause analysis | SaaS and Managed |
| Grafana + Prometheus | Open-source enthusiasts | Customizable dashboards | Self-hosted or Cloud |
| Splunk Observability | Large data-driven organizations | Advanced analytics capabilities | SaaS-based |
Observability in Cloud-Native Environments
Cloud-native architectures rely heavily on containers and orchestration platforms like Kubernetes. These environments are dynamic, with instances constantly scaling up or down. Traditional monitoring tools often struggle to keep pace with such rapid changes.
Observability software, however, automatically discovers services and adapts to infrastructure updates. It integrates with container orchestration systems to collect metrics without manual configuration.
In DevOps and Site Reliability Engineering (SRE) practices, observability aligns closely with continuous integration and continuous deployment (CI/CD) pipelines. Automated monitoring ensures new releases do not introduce performance regressions.
Key Considerations When Choosing Observability Software
Selecting the right observability platform depends on several factors:
- Scalability: Can the tool handle growing workloads and data volumes?
- Ease of Integration: Does it support existing cloud providers, programming languages, and frameworks?
- Cost Efficiency: Does pricing align with usage patterns and business goals?
- Security and Compliance: Are data encryption and compliance features robust?
- Automation Capabilities: Does it offer AI-driven anomaly detection and automated remediation?
A thorough evaluation ensures the chosen solution aligns with both technical requirements and long-term business objectives.
The Future of Observability
As systems become more complex, observability will continue evolving. Artificial intelligence and machine learning are playing an increasingly important role in predictive analytics and anomaly detection.
Future observability platforms are likely to offer:
- Greater automation in incident response
- Enhanced visualization tools
- Improved cross-team collaboration features
- Stronger security monitoring integration
The integration of security observability with performance monitoring—often referred to as security observability—is expected to become a standard requirement for enterprises seeking holistic system oversight.
Conclusion
Observability software has become indispensable in modern IT ecosystems. By providing real-time visibility into metrics, logs, and traces, these tools empower organizations to maintain high-performance systems, reduce downtime, and ensure customer satisfaction. Whether deployed in startups or large enterprises, observability platforms enable teams to move from reactive troubleshooting to proactive reliability management. As digital transformation accelerates, real-time observability will remain a foundational pillar of operational excellence.
Frequently Asked Questions (FAQ)
1. What is the difference between monitoring and observability?
Monitoring typically tracks predefined metrics and alerts teams when thresholds are exceeded. Observability goes deeper by allowing teams to explore system data to understand root causes and unexpected behaviors.
2. Why are metrics, logs, and traces important?
Metrics provide performance data, logs give detailed event records, and traces show request flows across services. Together, they offer complete visibility into system health.
3. Can observability software prevent downtime?
While it cannot eliminate all failures, observability significantly reduces downtime by enabling early detection, automated alerts, and rapid root cause analysis.
4. Is observability only for cloud environments?
No. Although especially valuable in cloud-native systems, observability tools can monitor on-premises, hybrid, and multi-cloud environments as well.
5. How does AI improve observability?
AI enhances observability by detecting anomalies, correlating events across systems, and predicting potential failures before they impact users.
6. What industries benefit most from observability?
Industries that rely heavily on digital services—such as finance, healthcare, e-commerce, and technology—gain significant advantages from real-time system monitoring.


")
