
Containers changed the way we build and ship software. They are light. They are fast. They move easily from a laptop to the cloud. But here is the catch. Once your containers are running, you need to keep an eye on them. If you don’t, small problems can grow very fast. That is where container monitoring tools step in. They help you track performance, spot issues, and sleep better at night.
TLDR: Container monitoring tools help you track the health and performance of your containerized apps. They show you metrics like CPU, memory, and network use in simple dashboards. Good tools also send alerts before things break. With the right monitoring setup, you fix problems faster and keep your apps running smoothly.
Why Monitoring Containers Matters
Containers are not like traditional servers. They start fast. They stop fast. They can appear and disappear in seconds. This makes them powerful. It also makes them tricky.
Imagine running dozens. Or hundreds. Or thousands.
Without monitoring, you are flying blind.
Here is why monitoring is important:
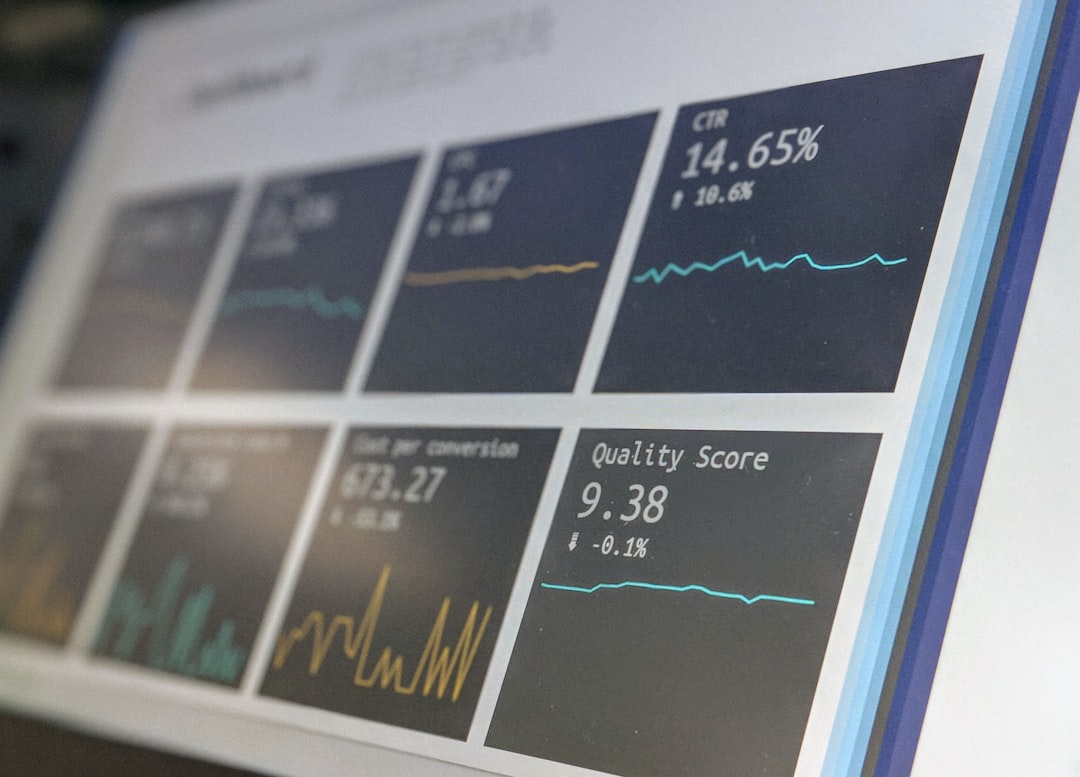
- Performance tracking: See how much CPU and memory each container uses.
- Failure detection: Catch crashes early.
- Resource optimization: Avoid waste.
- User experience: Keep apps fast and smooth.
- Security awareness: Detect unusual behavior.
In short, monitoring helps you move from panic mode to control mode.
What Should You Monitor?
Not all metrics are equal. Some numbers matter more than others. Start simple.
Here are the key things to watch:
- CPU usage – Is your container overloaded?
- Memory usage – Is it about to run out of RAM?
- Disk I/O – Is storage slowing things down?
- Network traffic – Are requests flowing normally?
- Container uptime – Is it restarting too often?
- Error rates – Are users seeing failures?
Think of these as vital signs. Like checking a pulse. Or temperature.
Types of Container Monitoring Tools
Container monitoring tools come in different flavors. Each has a role.
1. Infrastructure Monitoring Tools
These focus on the host machine. The server running your containers.
They answer questions like:
- Is the server overloaded?
- Is disk space running out?
- Is the network slow?
They give you the big picture.
2. Container-Level Monitoring Tools
These zoom in. They track each individual container.
They tell you:
- Which container uses the most memory?
- Which one keeps restarting?
- Which one is causing latency?
This is where things get interesting.
3. Orchestration Monitoring Tools
If you use Kubernetes, you need more than basic monitoring.
You need to see:
- Pods
- Nodes
- Clusters
- Deployments
These tools understand how containers work together.
4. Application Performance Monitoring (APM)
This goes deeper. It tracks what happens inside your app.
It shows:
- Slow database queries
- Broken API calls
- Long response times
- User experience issues
APM connects performance data to real user impact.
Popular Container Monitoring Tools
There are many tools out there. Some are open source. Some are commercial. Most are powerful.
Here are a few popular categories:
- Prometheus-based tools for collecting metrics
- Grafana dashboards for visualizing data
- Datadog for cloud-native monitoring
- New Relic for deep application insights
- Dynatrace for AI-assisted analytics
- Elastic Stack for logs and metrics together
The best choice depends on your setup. And your budget.
Key Features to Look For
When choosing a tool, don’t get distracted by fancy charts. Focus on value.
Look for these features:
- Real-time metrics – Data must be fresh.
- Custom dashboards – Build views that fit your needs.
- Alerting system – Get notified before users complain.
- Integration support – Connect with cloud and DevOps tools.
- Scalability – Handle growth without slowing down.
- Log correlation – Match errors with performance spikes.
Monitoring should simplify your life. Not complicate it.
How Alerts Save the Day
Let’s talk about alerts. They are your safety net.
A good alert system does three things:
- Detects the issue early.
- Sends a clear message.
- Points you to the root cause.
But here is the secret. Do not alert on everything.
Too many alerts cause noise. Noise causes ignored warnings. Ignored warnings cause downtime.
Instead:
- Set thresholds wisely.
- Prioritize critical services.
- Use escalation rules.
Smart alerts mean fewer headaches.
Logs, Metrics, and Traces Explained Simply
Monitoring often talks about three words. Logs. Metrics. Traces.
Let’s simplify.
Metrics are numbers over time. CPU usage. Memory usage. Requests per second.
Logs are event records. They tell you what happened.
Traces follow a request step by step. From start to finish.
When you combine them, magic happens.
You can:
- Spot a slow request
- Check which service delayed it
- Read the exact error message
That is powerful.
Monitoring in Kubernetes Environments
Kubernetes adds another layer. It manages containers automatically. It scales them. Restarts them. Moves them.
But it also creates more moving parts.
You now need visibility into:
- Cluster health
- Node capacity
- Pod performance
- Service communication
Tools designed for Kubernetes understand these relationships. They show how everything connects.
Without this visibility, debugging becomes guesswork.
Best Practices for Container Monitoring
Monitoring works best when done right from day one.
Here are simple best practices:
- Monitor early – Don’t wait for production.
- Define clear KPIs – Know what success means.
- Automate dashboards – Save time.
- Review metrics regularly – Don’t just collect data.
- Test alerts – Make sure they work.
- Keep it simple – Start small. Expand later.
Consistency beats complexity.
Common Mistakes to Avoid
Even good teams make mistakes. Here are common ones:
- Monitoring only infrastructure but not applications
- Ignoring log data
- Setting too many alerts
- Failing to monitor container restarts
- Not tracking resource limits
A simple mistake can hide a serious issue.
The Future of Container Monitoring
Monitoring tools are getting smarter.
Many now include:
- AI-driven anomaly detection
- Predictive scaling recommendations
- Automatic root cause analysis
- Cloud-native integrations
This means less manual digging. And faster solutions.
In the future, systems may fix problems before you even see them.
Final Thoughts
Container monitoring is not optional. It is essential.
Containers move fast. Your visibility must move faster.
With the right tools, you can:
- Track performance clearly
- Prevent downtime
- Optimize resources
- Improve user experience
Start simple. Focus on key metrics. Add alerts wisely. Combine logs, metrics, and traces.
When you monitor your containers the right way, you are not just watching numbers.
You are protecting your applications.
And that is a very smart move.


